
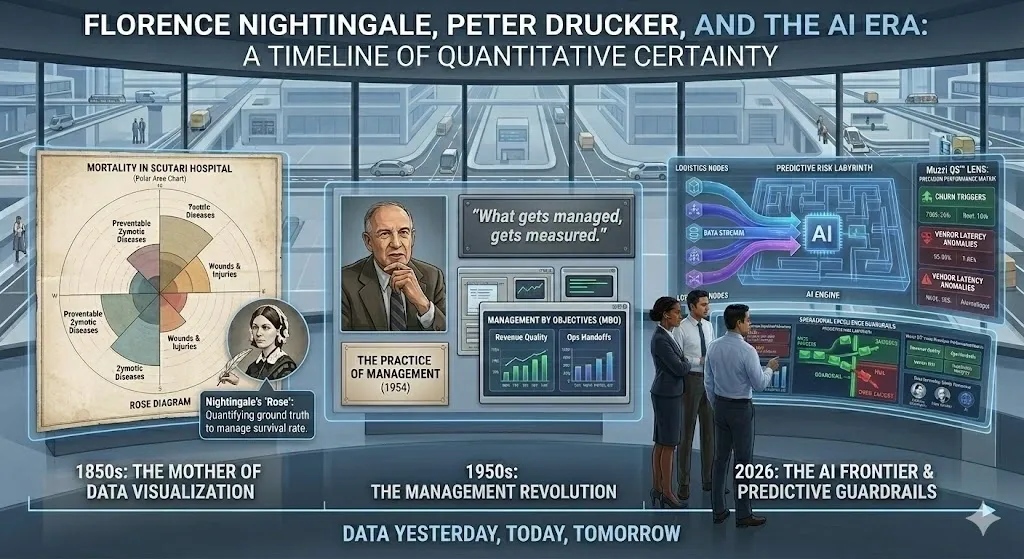
As we are in Week 10 of 2026, the “New Year adrenaline” has officially evaporated. We are now in the grind of execution. In the modern enterprise, we often find ourselves drowning in a sea of dashboards, yet starving for a single source of truth. To find our way forward, we must look back at a quote that has defined the last seventy years of industry:
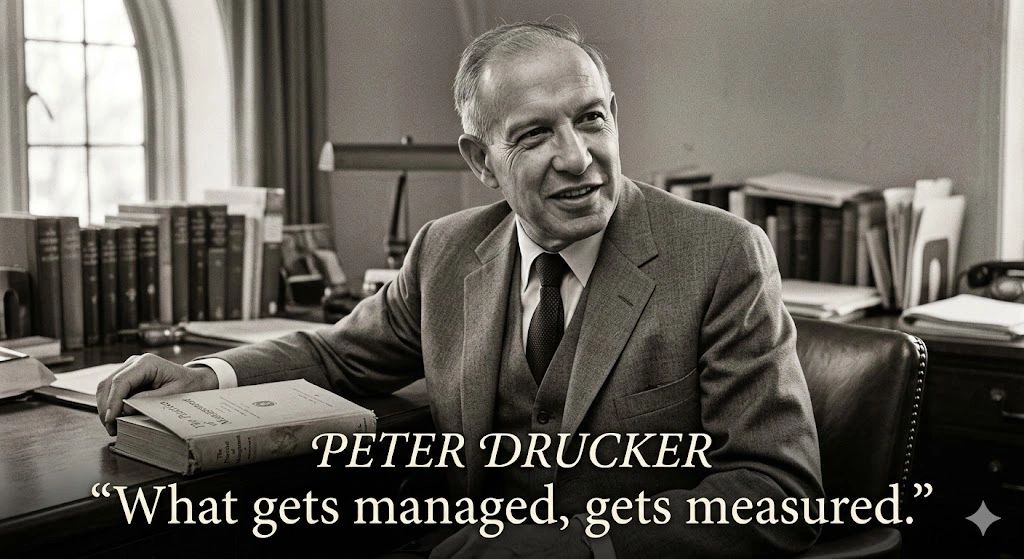
“What gets measured, gets managed.” – Peter Drucker (1954)
While Peter Drucker is credited with codifying this into the bedrock of management science, the soul of this philosophy was born a century earlier in the freezing corridors of the Scutari Hospital during the Crimean War.
The Legacy of the Rose: Data as a Life-Saving Tool
Several years ago, I had the privilege of being part of the UIW Young Women’s Global Leadership group. It was during this formative experience at the University of the Incarnate Word that I first encountered the true history of Florence Nightingale. While popular history remembers her as “The Lady with the Lamp,” her most enduring contribution to humanity wasn’t the lamp—it was her pen and her passion for statistics.
Nightingale was a pioneer of data visualization. When she arrived in the Crimea, she didn’t just see a lack of cleanliness; she saw a systemic failure in process architecture. However, she knew that telling the British government that hospitals were “dirty” would result in little more than a polite nod. To drive real change, she needed Quantitative Certainty.
She developed the “Rose Diagram”—a polar area chart that made the invisible visible. It proved, mathematically and visually, that ten times as many soldiers were dying from preventable infections caused by poor sanitation than from wounds sustained on the battlefield (Nightingale, 1858).
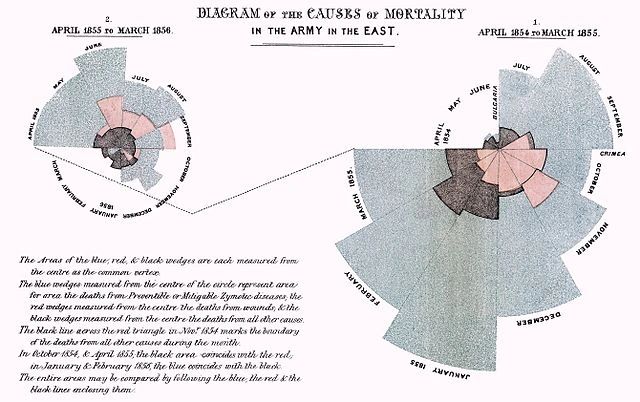
By measuring the mortality rates and managing the hygiene process, she reduced the death rate from 42% to 2%. This was the birth of the Data Guardrail: a boundary that, when crossed, signals an immediate need for leadership intervention.

1954: The Drucker Revolution and the Birth of Management
A century later, Peter Drucker (1954) revolutionized the corporate world by arguing that management was not an art form based on “gut feeling,” but a rigorous discipline. In The Practice of Management, Drucker introduced the world to the idea that a manager’s primary role is to set objectives and measure performance against them.
Drucker’s work shifted the focus from Activity to Results. He understood that without measurement, a company is simply a collection of people performing tasks in the dark. However, Drucker also provided a warning that many modern leaders forget: the danger of measuring the wrong things. Measuring “clicks” or “hours worked” provides the illusion of management, but if those clicks don’t convert to revenue, you are simply managing a decline. This is why we must implement Actionable Guardrails—metrics that trigger a specific, pre-planned business response.
2026: The AI Frontier and Predictive Guardrails
As we stand ten weeks into 2026, the landscape has shifted again. We have moved from Nightingale’s Descriptive data (what happened) and Drucker’s Diagnostic data (why it happened) into the era of Predictive and Prescriptive AI.
Today, “measuring” is no longer enough to maintain a competitive advantage. In a high-velocity market, waiting for a monthly report to tell you that a vendor missed their SLA is an “autopsy,” not an “audit.” Modern organizations require AI-Powered Guardrails—automated systems that flag anomalies in real-time, identifying “Churn Triggers” or “Process Latency” before they impact the bottom line.
The 10-Week Pulse Check: Implementing Data Guardrails
To help you navigate the remaining ten months of the year, I have distilled these historical and modern lessons into four critical quadrants of Data Guardrails. These are the “Rose Diagrams” for the 2026 leader.
1. Revenue & Sales Quality Guardrails
- Segment Profitability Limit: Establish a guardrail for Customer Acquisition Cost (CAC) vs. Lifetime Value (LTV). If the CAC for a specific segment exceeds 33% of the projected LTV, the system must trigger a marketing pivot (Verhoef et al., 2016).
- The “Vanity Filter”: Omit top-line lead volume from your primary dashboard. Instead, zone in on Lead-to-Opportunity velocity. If the time-to-conversion slows by more than 10% month-over-month, it indicates a breakdown in sales enablement.
2. Operational & Extended Workforce Guardrails
- Process Latency Caps: In complex IT and logistics projects, define a “Max Wait Time” for every handoff. When a work order sits in a silo longer than the defined guardrail, it should auto-escalate to a Program Manager to prevent “The Labyrinth” effect.
- The Ground Truth Protocol: Create a feedback loop where extended workforce members (contractors/vendors) can flag “bottleneck data” without fear of reprisal. This psychological safety is your best defense against compounding project debt (Senge, 1990).
3. Vendor & Infrastructure Guardrails
- SLA Compliance Alarms: Don’t wait for a contract renewal to discuss performance. Set automated alerts for vendor up-time and delivery speed. If a vendor falls below the 98% threshold for two consecutive weeks, it triggers a mandatory “Service Review.”
- Tool Redundancy Audit: If you have three different SaaS tools with overlapping features, you aren’t “hedging your bets”—you are creating data silos. Consolidate your stack to ensure a single source of truth.
4. The Human Guardrail: Leadership Integrity
- Vulnerability as Risk Mitigation: When a leader owns a strategic misstep early, it creates a “Cultural Anchor” for the team. This allows subordinates to flag their own errors while the “cost of repair” is still 1x, rather than waiting until it hits 100x in production (Brynjolfsson & McElheran, 2016).
Winning 2026 with Integrity
As we start March, remember that data is not just a history lesson; it is a competitive roadmap. Whether you are looking at a polar area chart from 1854 or a predictive AI model from 2026, the goal remains the same: Quantitative Certainty.
Success this year will not be defined by the amount of data you collect, but by the Guardrails you put in place to manage it. Let us move forward with the courage of Nightingale, the discipline of Drucker, and the technological foresight of the AI era. By implementing radical honesty and rigorous measurement, we ensure our organizations are not just moving, but progressing.
References (APA 7th Edition)
Brynjolfsson, E., & McElheran, K. (2016). The rapid adoption of data-driven decision making. American Economic Review, 106(5), 133-139.
Drucker, P. F. (1954). The practice of management. Harper & Row.
Nightingale, F. (1858). Notes on matters affecting the health, efficiency, and hospital administration of the British Army. Harrison and Sons.
Senge, P. M. (1990). The fifth discipline: The art and practice of the learning organization. Doubleday.
Verhoef, P. C., Kooge, E., & Walk, N. (2016). Creating value with big data analytics: Making smarter marketing decisions. Routledge.