

Operational backlogs rarely fail because people are unwilling to work. More often, they fail because the organization loses visibility into the system itself.
Several years ago, a cross-functional strike team was assembled to address a long-standing operational backlog that had remained unresolved for an extended period. The work spanned multiple regions, delivery partners, operational groups, and external dependencies. Despite sustained effort over time, meaningful progress had remained difficult to achieve.
By the time the initiative reached executive visibility, the backlog had grown significantly, and the organization was under increasing pressure to demonstrate measurable movement.
What followed became an important operational case study in how structured visibility, workflow segmentation, and data-driven execution can transform stalled workstreams into manageable systems.
Building the Strike Team
The recovery group consisted of roughly 12 individuals selected from various operational functions already involved in the workflow. During an early, fast-paced brainstorming session to define our mission, the team was tossing around naming ideas to capture the exact energy we needed. Out of nowhere, someone shouted, “Cheetah Team!” It instantly stuck.
The moniker wasn’t just catchy; it perfectly mirrored our operational strategy. Cheetahs are famously the fastest land animals on Earth, but their real superpower in the wild is the mechanics of their sprint. They don’t run long, exhausting marathons; they deploy explosive, hyper-focused bursts of speed to take down a specific target, using incredible agility to change direction mid-stride. For our group, the metaphor was exact. We weren’t built for a slow, multi-year crawl. We came together for a high-velocity, 90-day tactical sprint to tackle a stubborn backlog and eliminate it through rapid acceleration and real-time adaptability.
Selection for this group was highly intentional. The initiative required people who understood parts of the operational process, could interpret trends, work across functions, and adapt quickly in a rapidly changing environment. The team included personnel involved in workflow coordination, operational oversight, external dependency management, reporting, and delivery support. Many had previously worked within isolated areas of responsibility, which reflected one of the broader organizational challenges at the time: teams understood their portion of the process, but few had visibility into the system as a whole.
To bridge these gaps, the team required an operational anchor. We focused heavily on the mechanics of collaboration—establishing a tight cadence of synchronized meetings to untangle dependencies and centralizing fragmented metrics into a single, cohesive data structure. Daily consolidation of updates, trend tracking, and workflow visibility turned disconnected information into actionable operational intelligence.
The Initial Problem: Information Existed, but Visibility Did Not
One of the earliest observations was that the organization did not lack updates; it lacked operational structure.
Conversations about the backlog were highly fragmented. Meetings frequently focused on isolated vendor updates, region-specific issues, or disconnected workflow concerns:
- Certain workstreams were delayed due to external dependencies.
- Some regions faced recurring approval bottlenecks.
- Vendor communication varied significantly across teams.
- Handoffs between operational groups lacked consistency.
At the same time, blocked work, delayed work, and healthy work were often discussed interchangeably, creating limited clarity around actual workflow conditions. This fragmentation created several downstream challenges:
- Unclear accountability
- Inconsistent escalation paths
- Incomplete visibility into aging work
- Difficulty identifying systemic bottlenecks
Operationally, teams had become optimized around maintaining their own slice of responsibility rather than improving overall workflow movement. Before solutions could be implemented, the operational picture itself needed to be simplified.
Applying Kanban-Style Workflow Management and Operational Segmentation
The first major shift involved restructuring how the work was viewed.
Rather than organizing conversations around individual vendors or isolated workstreams, the backlog was segmented into operational states using a Kanban-style visual workflow management approach combined with triage-based operational segmentation.
The work was grouped into three primary workflow states:
- Red: Blocked work
- Amber/Yellow: Delayed or at-risk work
- Green: Actively progressing work
Initially, the definitions were intentionally simple. The immediate priority was not perfect categorization, but consistent visibility. This segmentation model created a shared operational language across teams and enabled a clearer understanding of system behavior.
Ownership was then aligned around those workflow states. Team members across regions collaborated to monitor movement between categories, identify recurring blockers, and maintain visibility into stalled work. This effectively created a form of cross-functional swarm execution, where resources were aligned dynamically around workflow conditions rather than rigid operational silos.
The impact of this shift became noticeable relatively quickly. Instead of isolated conversations centered on specific vendors or localized issues, discussions became increasingly focused on workflow behavior:
- What work was moving efficiently?
- What work was aging?
- What blockers appeared repeatedly?
- Which dependencies consistently delayed execution?
- Which delivery partners demonstrated sustained throughput?
This represented a transition away from reactive coordination and toward operational management.
How Data Changed Decision-Making
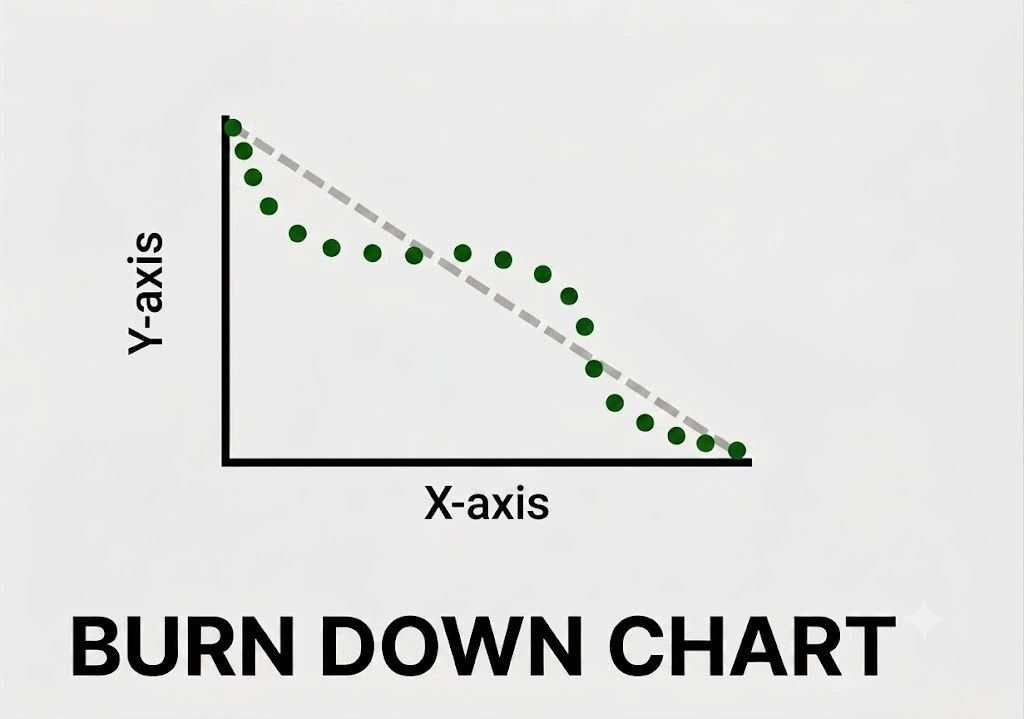
One of the most important lessons from the initiative was that data only becomes valuable when it changes operational behavior. Early in the process, discussions remained heavily anecdotal. Teams naturally defaulted to discussing only the vendors, regions, or workflows directly tied to their own responsibilities.
To shift this paradigm, we introduced a Burndown Chart as our primary visual compass for the 90-day sprint. By mapping our actual progress against a theoretical ideal baseline, the Burndown Chart stripped away the anecdotes. It provided an unvarnished, day-by-day look at our velocity, instantly highlighting whether our recovery velocity was on track or stalling.
With the data centralized and visualized, the focus shifted toward targeted analytical questions:
- How long were the items remaining blocked?
- Were certain regions aging faster than others?
- Which dependencies repeatedly slowed execution?
- Which delivery partners converted work consistently?
- Which problems represented isolated exceptions versus systemic constraints?
Daily operational cadence management created a consistent rhythm for reporting, reviewing trends, escalating blockers, and identifying movement opportunities. Centralized visibility enabled the team to move beyond static status updates and toward targeted operational intervention.
As recurring patterns became visible, feedback-loop optimization naturally emerged within the operating model. Teams could rapidly identify ineffective workflows, adjust escalation paths, redistribute effort, and refine execution strategies in near real-time. Once trends became visible, decisions became significantly easier.
Accountability Through Operational Transparency
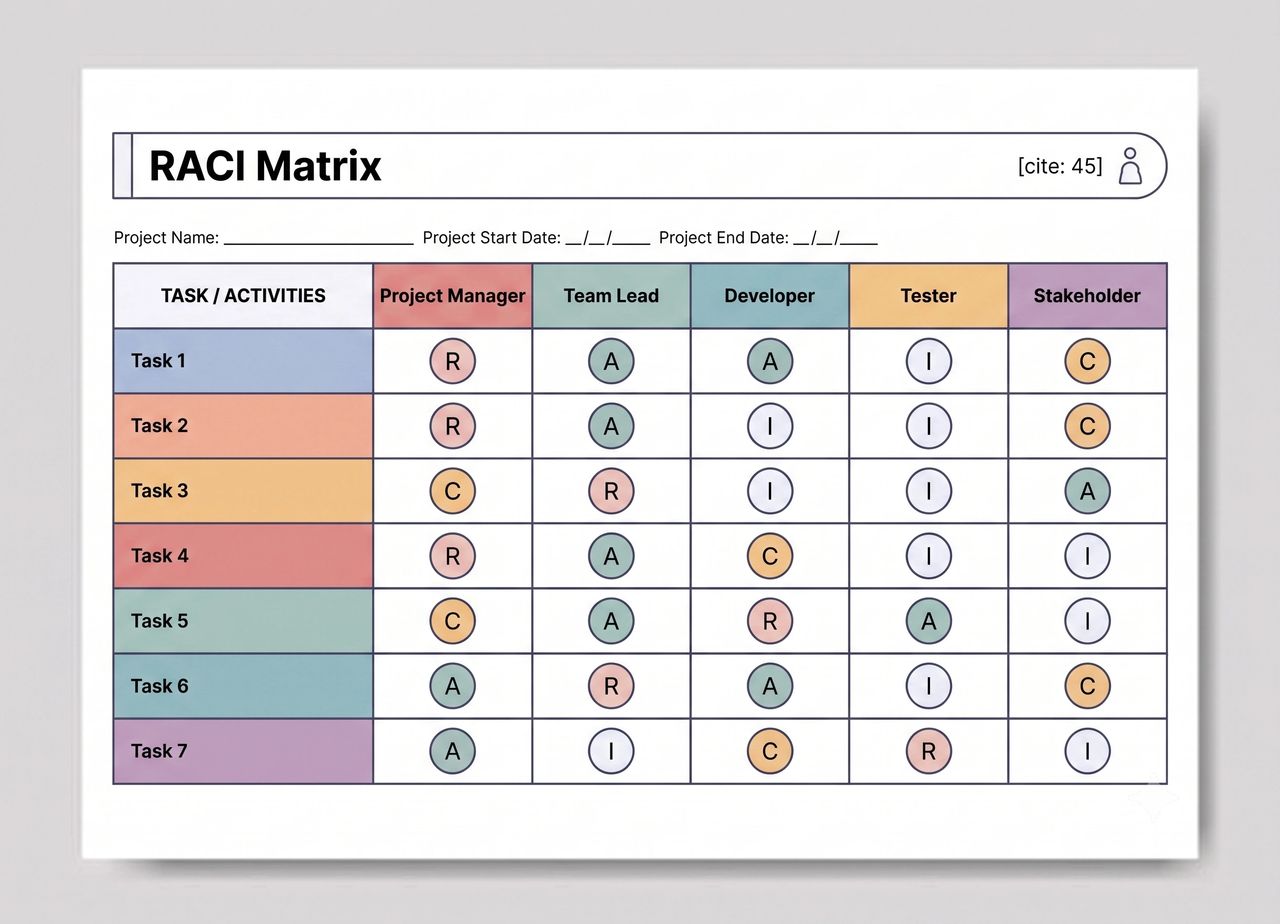
As workflow visibility improved, accountability became easier to establish. Rather than relying on generalized discussions around delays, the team could identify where throughput consistently slowed and where intervention was required.
To formalize this transparency, we deployed a strict RACI Chart (Responsible, Accountable, Consulted, Informed). In a fast-moving sprint involving an extended workforce, ambiguity is the enemy. The RACI matrix clearly mapped out exactly who owned the execution of critical sub-tasks, who held ultimate accountability, who needed to be consulted on dependencies, and who simply required updates. This clarified decision-making responsibilities and established clear, predictable escalation paths across the entire cross-functional workflow.
In some situations, workload distribution had to be adjusted dynamically based on execution capability and operational responsiveness. Delivery partners demonstrating sustained progress were trusted with additional work, while recurring delays triggered deeper operational reviews and escalation discussions.
Internally, teams also became more proactive in identifying blockers earlier because stagnation was no longer hidden within fragmented reporting structures. Importantly, the initiative did not focus on assigning blame. The emphasis remained on improving operational workflow.
The discussion evolved from “Who owns this issue?” to “What is preventing this work from processing?” That distinction significantly improved collaboration across groups.
The Human Side of Operational Recovery
Operational recovery efforts are often discussed purely in technical terms, but team dynamics played an equally important role in the success of this initiative. Long-standing backlogs create operational fatigue. Over time, organizations can begin to normalize stagnation and reduced expectations.
To counter that effect, the team intentionally created space for personal connection and shared ownership. Meetings regularly included time for open discussions beyond workflow updates alone. Team members shared milestones, life events, and personal goals, which helped strengthen cohesion within a fast-paced operational environment.
We also sought to deliberately cultivate a distinct team identity to break through the feeling of isolated vendor structures. We designed custom team merchandise—awesome, dedicated “Cheetah Team” gear featuring our new mascot—that served as a badge of honor for the group. It shifted the narrative from a group of disparate contractors working on a stressful backlog to an elite, unified unit on a shared mission.
Small incentive goals tied to backlog reduction milestones also helped reinforce momentum. While the rewards themselves were modest, they provided the team with tangible objectives and reinforced a sense of shared progress. These elements became important operational multipliers. Sustained execution under pressure is rarely driven by process alone. Teams perform differently when they feel connected both to the mission and to one another.
The Outcome
Over the course of the 90-day sprint, the backlog declined at a pace the organization had not previously experienced. Work that had remained stagnant for extended periods began moving more consistently through the operational pipeline.
More importantly, the operational framework outlasted the recovery effort itself. The workflow segmentation model, reporting cadence, tracking structures, escalation patterns, and operational playbooks developed during the initiative continued influencing similar operational programs afterward. The visibility framework created during the recovery effort became a lasting reference point for managing aging workflows and identifying bottlenecks more effectively.
Looking back, the most important takeaway was not simply the backlog reduction itself. It was the realization that operational transformation often begins with something much simpler than advanced tooling or complex systems:
Clarity. Once teams gained a consistent view of the workflow, they were finally able to improve it together.
A Note of Appreciation
Bringing this recovery initiative to life required a relentless focus on both data and people. A massive thank you to Patrick Chike for his incredible leadership throughout this 90-day sprint, his unwavering commitment to driving operational velocity, and his collaboration in co-authoring this case study. It was a privilege to build the systems, align the metrics, and run alongside the “Cheetah Team” together.
About the Authors
About Patrick Chike: Operations Leader & Author specializing in systematic process design, cross-functional alignment, and technical workflow optimization. * LinkedIn Profile
About the Co-Author, Myriam Hernandez Muzquiz: Manager and Operations Consultant specializing in data analytics, CRM architecture, and strategic PMO frameworks.